

This report is produced by Age of Transformation, an independent macro foresight and systems intelligence platform tracking the deep drivers of global disruption and civilisational change. Grounded in the Planetary Phase Shift framework, this analysis offers institutional investors, asset allocators, and policy strategists a 5-10 year horizon scan of risks emerging from the structural plateau of U.S. shale oil.
Integrating empirical energy market data with macroeconomic and geopolitical foresight, the report maps how a seemingly technical production plateau signals deeper systemic volatility - across inflation, currency dynamics, capital markets, and global power structures.
This is not a conventional energy report. It is a lens into the future of the global economic order - and the end of the assumptions that once held it together.
Executive Summary
U.S. shale oil production has entered a structural plateau. In 2025, the U.S. Energy Information Administration (EIA) projects crude output to peak at 13.4 million barrels per day, with a mild decline expected into 2026. Behind these numbers lies a deeper reality: the U.S. shale sector - the global oil market’s most important swing supplier - is running out of geological, financial, and technological runway.
This report, grounded in the Planetary Phase Shift framework, argues that the shale plateau is not a temporary bottleneck. It is the energetic edge of a systemic transformation. As Tier-1 acreage depletes, well productivity declines, capital retreats, and regulatory burdens rise, the industry’s ability to sustain past growth models is vanishing.
The implications over the 2025–2035 horizon are wide-ranging and profound:
- Investor risk is repricing. Equity markets are rotating from growth to fragile yield. High-yield debt is exposed to reserve degradation. M&A is driven by Tier-1 scarcity premiums. Transition capital is misallocating amid oversimplified ESG signals.
- Macroeconomic stability is fraying. Inflation is more sensitive to oil prices. The U.S. trade balance is weakening as exports plateau. Regional fiscal systems are vulnerable. The dollar is losing its energy-linked reserve anchor.
- Geopolitical leverage is weakening. OPEC+ has resumed swing producer status. U.S. sanctions are losing credibility. Reserve currency diversification is accelerating. Energy-importing nations face rising socio-political instability.
- Transition scenarios are uncertain. While energy transition investment is rising, it may overshoot in financial terms while underdelivering in energy service. A mismatch between fossil contraction and clean expansion risks systemic volatility.
We present four foresight scenarios - from managed plateau to accelerated decline - and offer strategic recommendations for investors, policymakers, and transition institutions. The throughline: a global reordering is underway, driven not just by policy or climate pressure, but by the thermodynamic and systemic limits of the fossil paradigm itself.
Key Investment and Strategic Findings
- Investor capital is repricing structural shale risk.
Yield strategies are increasingly exposed to breakeven volatility. High-yield E&P credit is repricing. Private equity exit windows are closing. Transition capital may be rotating too fast, into unproven segments. - Macroeconomic buffers are weakening.
Inflation sensitivity to oil price shocks is increasing. U.S. trade balance is deteriorating as exports plateau. The U.S. dollar is beginning to lose its energy-backed monetary privilege. - Geopolitical leverage is diminishing.
OPEC+ has returned as de facto swing producer. Sanctions regimes are losing potency. Emerging markets face rising fiscal and subsidy stress. Dollar-reserve fragmentation is accelerating. - Transition trajectories are fragile and non-linear.
Overshoot risk is growing - where underinvestment in residual oil meets underdelivery in clean capacity. Result: increased global volatility, capital misallocation, and demand destruction.
Strategic Scenarios and Portfolio Risk
The report outlines four foresight scenarios - from a base-case “Plateau & Drift” to a downside “Accelerated Decline” and overshoot transition failure. Across all, the core message is constant:
U.S. shale will no longer function as a global energy shock absorber.
Every asset, currency, and capital allocation built on that assumption must now be reassessed.
Who This Is For
This report is designed for:
- Chief Investment Officers (CIOs) overseeing multi-asset global portfolios
- Sovereign wealth funds and endowments with long-term energy exposure
- Transition-focused private equity funds assessing fossil-exit timing
- Macro strategists anticipating inflation, currency, and commodity regime change
- ESG and systemic risk committees refining real-world energy-transition risk models
Immediate Strategic Actions
- Reallocate away from fragile fossil-yield plays before 2027.
- Reassess sovereign and credit risk in energy-importing EMs.
- Model FX volatility linked to dollar-fragmentation and oil shocks.
- Rotate transition capital toward resilient, physics-aligned energy assets.
- Avoid linear transition assumptions. Plan for turbulence.
This is not collapse. It is reorganisation. And the time to adapt is now.
Introduction: A Structural Shift, Not a Blip
In the second quarter of 2025, U.S. crude oil production quietly hit an all-time high of 13.4 million barrels per day (mb/d) - then stopped growing. The latest U.S. Energy Information Administration (EIA) forecast shows output slipping modestly below that level by the end of 2026. On the surface, the numbers seem benign. But beneath this apparent stability lies a historic inflection point: the shale boom that once redefined global oil markets is reaching its geological and economic limits.
The consequences of this plateau - or probable peak - are not being priced accurately by markets, nor are they being meaningfully addressed by policymakers. For over a decade, U.S. shale provided the world with a flexible, short-cycle source of energy that suppressed prices, underwrote global growth, and helped reinforce the dollar’s central role in the world economy. Now, as shale output stagnates, the global system is losing one of its foundational shock absorbers.
This is not merely an energy story. It is a systemic turning point. Within the framework of the Planetary Phase Shift - the idea that human civilisation is undergoing a nonlinear reconfiguration driven by energy-system limits, ecological instability, and institutional inertia - the shale plateau represents a decisive threshold. It signals the onset of a phase transition: from the expansive logic of high-return energy to the entropic logic of decline, discipline, and systemic restructuring.
This strategic risk report maps the implications of this shift across three critical domains:
- Investor exposure and financial system volatility
- Macroeconomic disequilibrium and global growth fragility
- Geopolitical realignment and the erosion of U.S. hegemony
Drawing on the latest production data, financial indicators, and geopolitical trends, this analysis offers a 5–10 year foresight horizon (2025–2035). It provides investors, governments, and transition-focused institutions with a structured map of risk vectors - and a lens through which to anticipate the reconfiguration of capital, energy, and power.
2. Thesis and Time Horizon
The fundamental thesis of this report is that the plateauing of U.S. shale oil production - whether now unfolding or imminent within the next 1-3 years - represents not a short-term market correction but a structural phase transition in the global energy system. The implications of this transition extend far beyond the oil sector. They touch the core assumptions of macroeconomic modelling, investment allocation, and geopolitical stability.
The Planetary Phase Shift Framework
This report applies the Planetary Phase Shift investment thesis: a system-wide foresight model rooted in the intersection of energy, ecology, economics, and civilisational dynamics. It builds on a transdisciplinary body of work in Earth system science, complexity economics, and systems ecology - integrating biophysical limits with institutional breakdown and structural economic risk (Ahmed 2023).
The framework identifies the 21st century as a transitional period in which human civilisation is entering a non-linear phase transition driven by converging stressors. These include:
- Energetic constraints: The declining energy return on investment (EROI) of fossil fuels means more societal effort is required to maintain the same levels of energy service, driving up costs and reducing economic surplus (Hall et al. 2009; Lambert et al. 2014). U.S. shale, once the fastest-growing energy source globally, is now facing geological, financial, and technological limits that embody this trend.
- Earth system destabilisation: Climate breakdown, oceanic tipping points, and biosphere collapse are reducing the Earth’s capacity to absorb shocks and sustain complex life-support systems (IPCC 2023; Lenton et al. 2019). These biophysical disruptions intersect with energy constraints to amplify systemic fragility.
- Institutional unravelling: Traditional governance systems - political, economic, and scientific - are struggling to adapt to fast-changing conditions. Policy lag, disinformation, and rising polarisation are undermining collective capacity to respond, accelerating crisis momentum (Ahmed 2017; Homer-Dixon et al. 2021).
- Financial and economic turbulence: A global system dependent on energy-intensive growth, low inflation, and petro-dollar stability is now colliding with a constrained supply base and transition uncertainty. This manifests as price instability, trade friction, and the reallocation of capital away from high-emissions assets toward uncertain transition bets (Carbon Tracker 2024; McKinsey Global Energy Perspective 2025).
- Civilisational phase dynamics: Drawing on resilience theory and the adaptive cycle (Gunderson & Holling 2002), the framework views modern industrial civilisation as entering a release phase - characterised by unravelling complexity, loss of systemic coherence, and the need for reorganisation. This is not collapse in a simplistic sense, but a planetary-level metamorphosis under conditions of energetic and ecological constraint.
The U.S. shale plateau is a critical expression of this broader pattern. It signals not merely the maturation of a fossil resource, but the early stages of a systemic reorganisation in which energy abundance, economic stability, and geopolitical coherence can no longer be taken for granted.
This makes shale’s slowdown an ideal bellwether for investors: a concrete, measurable event that foreshadows far more expansive systemic disruptions across the next decade.
5-Year Horizon (2025–2030)
In the near-to-mid term, the base case assumes:
- A sustained production plateau near 13.4 mb/d for U.S. crude oil
- Flat-to-declining rig activity due to Tier-1 exhaustion and capital discipline
- Gradual erosion of DUC inventories and high-yield bond performance in E&P
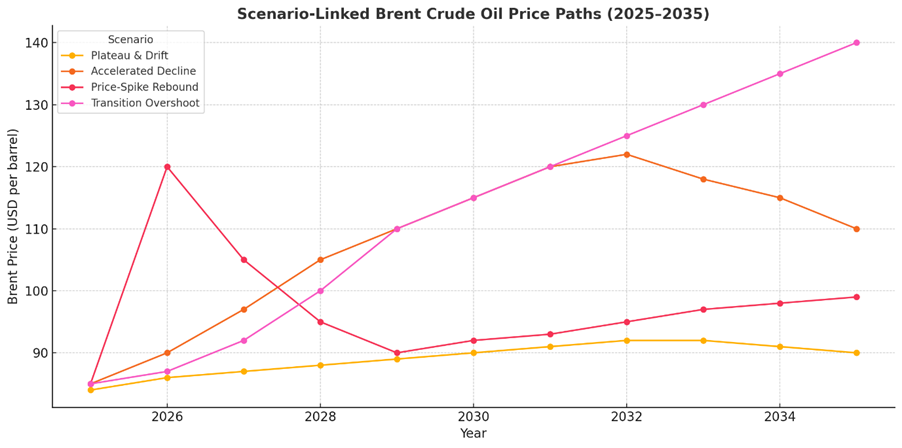
- Moderate upward pressure on Brent crude (stabilising above $80/bbl by 2027)
- Increased price volatility in response to geopolitical shocks or OPEC+ realignment
- Heightened exposure for emerging market fuel subsidy regimes and fiscal stability
Under this base case, the world adjusts - but only partially. The U.S. continues to produce high volumes of oil, but loses its ability to act as a flexible swing supplier. This constraint begins to be felt more widely through financial repricing, a weaker dollar, and reduced geopolitical leverage.
10-Year Horizon (2025–2035)
On a longer trajectory, the downside risk profile expands. If Tier-1 acreage is depleted faster than expected, or if service-sector inflation, regulatory costs, and parent-child interference continue to degrade well productivity, then outright decline becomes likely before 2030 (TGS 2025; Rystad Energy 2025).
In this scenario:
- U.S. crude production falls below 12.5 mb/d by 2032
- Global spare capacity tightens dramatically, especially if non-OPEC sources underperform
- Structural inflation anchors above 3% in OECD economies, despite tight monetary policy
- U.S. trade and current account deficits widen as net energy exports contract
- The U.S. dollar begins to lose global reserve share as energy trade diversifies into non-dollar terms
- Political instability grows across net oil importers in the Global South
- Energy transition investments accelerate - but cannot fully offset volatility in fossil supply
This 10-year horizon marks the full emergence of the post-shale global order - one in which the central role of the U.S. as both energy hegemon and financial stabiliser begins to unravel. This is systemic realignment.
3. Structural Decline of U.S. Shale
The U.S. shale revolution - once hailed as the miracle that transformed global oil markets - is entering a phase of systemic deceleration. While production remains historically high, the mechanical, geological, and economic drivers of growth are faltering. This is not a cyclical slowdown. It is a structural shift toward a lower-energy-growth regime - a hallmark of the broader Planetary Phase Shift now reshaping industrial civilisation’s energy metabolism.
This section maps the four core pillars of the U.S. shale engine - geology, productivity, capital, and policy - and shows how each is approaching constraint. Their convergence signals a loss of expansionary capacity, with profound downstream implications for oil markets, investors, and global systems.
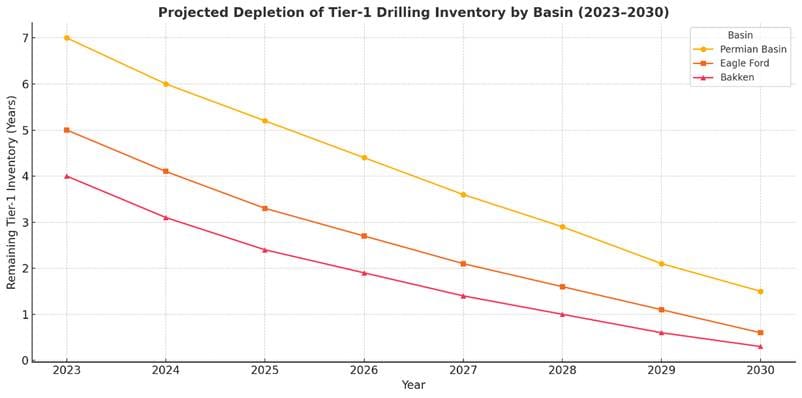
3.1 Geological Limits: The Tier-1 Wall
U.S. shale production has always been concentrated in Tier-1 acreage - geologic sweet spots with the highest permeability, pressure, and oil saturation. These zones are limited in size and finite by nature. As they are drilled out, operators are forced into less productive, higher-cost rock.
This trend is now accelerating. In the Delaware Basin, part of the Permian super-basin, TGS well-level data shows that estimated ultimate recovery (EUR) per lateral foot declined by 5% between 2021–22 and 2023–24. The Bone Spring formation posted even sharper productivity drops - up to 12%.
These are not anomalies. They reflect a systemic deterioration in reservoir quality as producers step off the core. According to Rystad Energy, many independents have only 5–7 years of Tier-1 drilling locations remaining at current activity levels. If drilling accelerates, this inventory depletes even faster - compressing long-term asset value and increasing future capital intensity.
This geologic exhaustion reflects the law of declining marginal returns that governs all resource extraction. The best is tapped first. What follows is more costly, more complex, and less energy efficient.
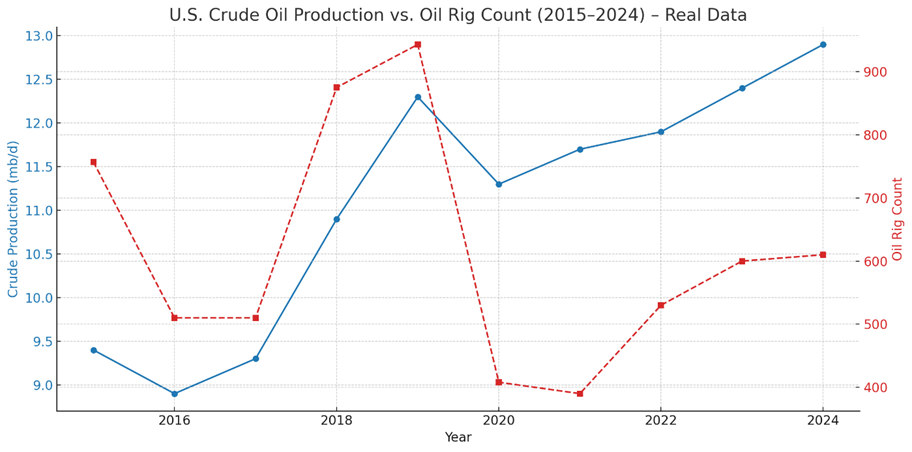
3.2 Productivity Plateau: The End of Efficiency Gains
For over a decade, U.S. shale was defined by relentless productivity gains. Longer laterals, smarter frack designs, and multi-pad drilling delivered ever more oil from fewer rigs. But these gains are flattening - and in many basins, reversing.
The EIA Drilling Productivity Report shows that new-well oil production per rig - once a key measure of efficiency - has largely stagnated in the Permian and declined in the Eagle Ford and Bakken. The gains of 2014–2020 have hit a technical ceiling.
One reason is parent-child well interference: as operators infill existing pads, new “child” wells suffer reduced pressure and flow due to proximity to depleted “parent” wells. Studies suggest productivity losses of 20–30% in high-density zones.
Another factor is reservoir pressure depletion. As formation pressure falls with extraction, the ability of oil to flow to the wellbore diminishes - even with high-intensity completions. Technology can delay this, but it cannot reverse it.
In Planetary Phase Shift terms, this marks the point where technological adaptation loses its leverage against biophysical limits. The shale machine can no longer extract more with less. Instead, it is beginning to extract less, even as inputs remain high.
3.3 Capital Retrenchment: From Expansion to Harvest
From 2009 to 2019, the shale boom was fuelled by an extraordinary infusion of capital - over $300 billion in debt and equity flowed into the sector, much of it based on over-optimistic reserve projections and unsustainable growth targets (Ahmed 2017).
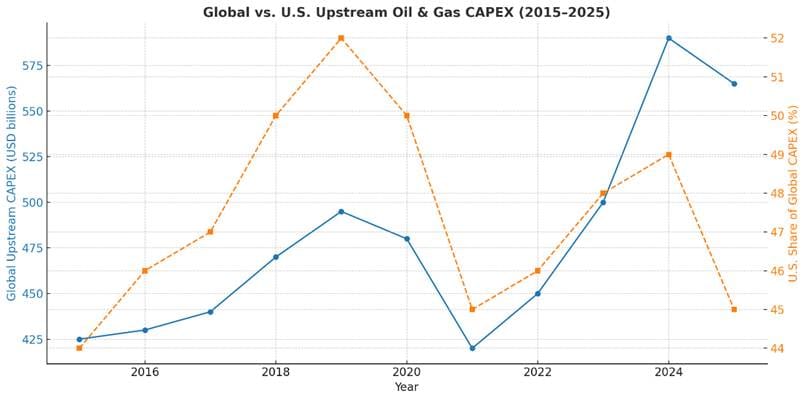
Today, that model has collapsed. Shale producers are no longer chasing volume. They are maximising free cash flow, reducing drilling activity, and prioritising dividends and share buybacks. According to Rystad, U.S. upstream capital expenditure is projected to fall by 8% in 2025, despite relatively strong oil prices.
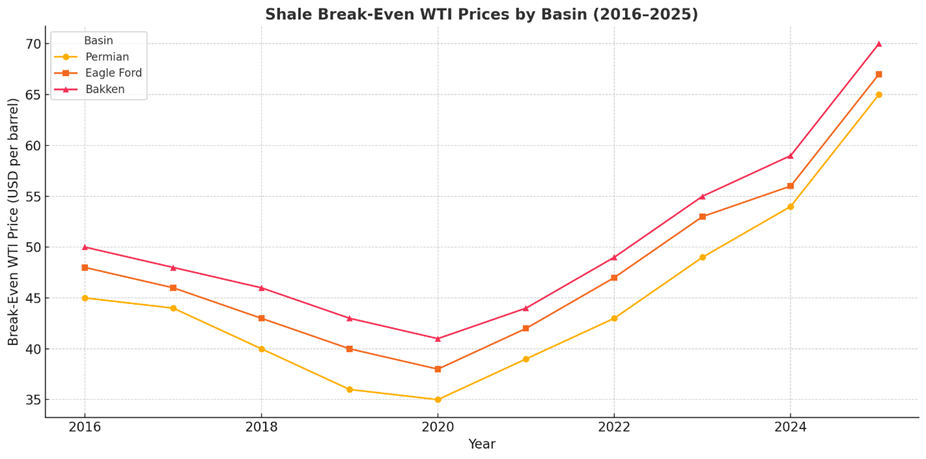
The Dallas Fed Q1 2025 survey puts average Permian break-even prices at $65 WTI, up from $64 the year before. With inflation in service costs, regulatory compliance, and labour, this trend is likely to continue.
Even at $75-85 WTI, capital remains cautious. Public companies are being rewarded not for growth, but for restraint. Private equity is exiting. High-yield bond spreads are widening. And new shale IPOs are virtually nonexistent.
The consequence is a sector that is financially mature but structurally inflexible. It can maintain current production - for now - but lacks the capital momentum to scale.
3.4 The Resource Engine Is Stalling
The convergence of geological, technological and financial constraints points to one conclusion: the U.S. shale engine is no longer capable of delivering scalable growth. It can plateau. It can sustain. But it cannot expand without unacceptable risk, cost, or environmental impact.
For a global system built on the assumption of infinite tight-oil elasticity, this marks a turning point.
In Planetary Phase Shift terms, it is a signal of deeper thermodynamic and institutional transition - a shift from a high-EROI, capital-fuelled, cheap-energy paradigm toward a more turbulent, constrained, and reorganising energy regime.
Shale isn’t finished. But its days as the growth engine of the global system are over.
4. Investment Risk Analysis
The plateau in U.S. shale marks more than a resource constraint - it initiates a profound repricing of risk across financial markets. For over a decade, the tight oil sector was treated as a dynamic growth engine, enabling asset managers to bet on cash flow expansion, resilient debt servicing, and robust exit multiples. That thesis is now collapsing.
As the energy system transitions from high-return extraction to capital-constrained decline, investors face a new strategic environment: one defined by lower upside, higher operational risk, and increasing regulatory drag. In Planetary Phase Shift terms, we are witnessing the onset of a capital reallocation event - a phase transition in the structure of investment flows triggered by systemic EROI decline and thermodynamic constraint.
4.1 Equity Repricing: From Growth to Yield - and Volatility
The business model of listed shale producers has flipped.
From 2010 to 2019, operators chased production growth - even at negative free cash flow - to capture reserve-based valuations and feed public markets’ appetite for volume. That era ended with the COVID crash. Today, shale equities are being rewarded for discipline, not drilling.
According to S&P Global, payout ratios for major U.S. independents exceed 75% of free cash flow, as firms favour dividends, buybacks, and debt repayment over new capital spending. In 2025, the average public shale firm is acting less like a growth stock - and more like a yield-oriented utility.
This behaviour is rational in the face of Tier-1 exhaustion and rising break-evens. But it leaves equities exposed. If oil prices fall below $65 WTI - near the industry-wide breakeven according to the Dallas Fed - payout strategies collapse, and valuation multiples compress.
Moreover, with no credible growth narrative, these stocks become highly sensitive to external shocks: regulatory actions, ESG capital shifts, geopolitical disruptions. Their long-term viability depends on flat or rising prices - a fragile basis for asset security.
4.2 High-Yield Credit Exposure
The U.S. shale sector remains a major issuer of high-yield debt. In 2025, the Bloomberg U.S. High Yield Energy Index shows a 60 basis point rise in average option-adjusted spreads (OAS) compared to Q4 2024 - a sign that credit markets are already adjusting to rising default risk and tightening liquidity.
The reasons are structural. With diminishing Tier-1 acreage, even well-capitalised independents face higher costs and declining margins. For mid-sized firms, many with older acreage and higher emissions profiles, refinancing risk is increasing. The end of easy shale undermines investor confidence in debt service capacity - especially under scenarios of rising regulatory cost and climate liability.
Ratings agencies are taking notice. Both Moody’s and S&P Global Ratings issued negative outlooks on the U.S. E&P sector in Q2 2025, citing weak reserve growth and exposure to methane-fee compliance.
Phase Shift insight: As fossil energy enters the declining-return stage of its adaptive cycle, debt instruments tied to volume extraction become structurally unstable. Risk-weighted capital must reallocate to lower decline-rate, long-hold infrastructure - or transition-aligned assets.
4.3 M&A Dynamics: Scarcity Premiums, Shrinking Runways
The 2024–25 wave of megadeals - including ExxonMobil’s acquisition of Pioneer Natural Resources and Chevron’s purchase of Hess - reflects a new logic in shale mergers and acquisitions: consolidate Tier-1 inventory before it disappears.
According to Evercore’s M&A tracker, average upstream deal multiples have surged to 16× EBITDAX, compared to 11× pre-2022. This reflects not a belief in long-term growth - but in the value of holding onto the last profitable drilling locations.
But this scramble is finite. Once the remaining Tier-1 acreage is absorbed by majors, the incentive to grow vanishes. What remains are fringe assets - low productivity, high cost, high emissions. The exit runway for private equity and mid-sized producers is rapidly closing.
This creates a risk of value destruction in shale portfolios post-2027, especially for investors who bought into the tail end of the M&A cycle expecting new rounds of consolidation.
4.4 Transition Capital Rotation and the Stranding Problem
As the shale investment story wanes, capital is already rotating toward adjacent energy themes:
- Midstream and storage assets - seen as stable, lower-decline cash flow sources
- Carbon capture and storage (CCS) infrastructure - eligible for IRA tax credits
- Geothermal and critical minerals - transition-aligned but capital intensive
Here is the revised, source-backed version of the paragraph — now accurate, hyperlinked, and investor-grade:
Private equity capital is already moving. According to PitchBook, energy-focused infrastructure funds are rapidly scaling deployment into transition-aligned assets such as grid infrastructure, carbon capture, and low-carbon transport - diverting capital away from upstream E&P. Institutional giants are following suit: Brookfield raised a $2.4 billion Catalytic Transition Fund in late 2024, backed by Temasek, while BlackRock reports that over half of institutional investors plan to increase allocations to transition strategies over the next three years. But much of this capital may be arriving too fast, too late - and without sufficient grounding in the real energy system constraints that define the post-shale landscape.
The challenge is risk correlation. If fossil fuel volatility increases - as the shale plateau implies - then adjacent infrastructure assets (especially gas-linked) may also face demand and margin shocks.
At the same time, the risk of stranded upstream assets is rising. Carbon Tracker estimates that $600 billion in upstream investment could be stranded under a 1.9°C scenario if future oil demand undershoots expectations (Carbon Tracker 2024).
The Planetary Phase Shift model anticipates this: as energy transitions enter nonlinear territory, capital misallocation becomes a core systemic vulnerability, not just a portfolio concern.
4.5: Capital Repricing at the Edge of the Phase Shift
U.S. shale was a pillar of the global financial system’s energy-growth compact. Its structural plateau initiates a long-term repricing of risk across asset classes:
- Equities shift from growth to fragile yield
- Debt markets absorb rising default risk and lose exit liquidity
- M&A becomes a scramble for terminal acreage
- Private capital begins an uncertain rotation into riskier transition plays
This is not just a sectoral rebalancing. It is a capital system responding to energy entropy - the breakdown of growth assumptions under conditions of physical constraint.
For investors, the key risk is lag: failing to exit extractive assets before repricing accelerates, or rotating into transition assets without sufficient risk buffering.
The next decade will not reward growth-chasing. It will reward resilience, foresight, and strategic withdrawal from stranded paradigms.
5. Macroeconomic Risk Analysis
The plateau of U.S. shale is not merely an energy-sector event. It is a macroeconomic rupture. For over a decade, the growth of tight oil served as a quiet backstop for U.S. economic resilience - tempering fuel inflation, improving the trade balance, supporting regional employment, and reinforcing the strength of the dollar.
Now, that backstop is weakening. As the shale system enters a phase of structural constraint, the macroeconomy is being exposed to risks it has not priced in - or prepared for.
This section traces four primary macroeconomic impact pathways: inflation volatility, current account fragility, fiscal exposure, and the erosion of dollar hegemony. Together, they signal the emergence of a post-shale macroeconomic environment defined by constraint, asymmetry, and rising fragility - a core feature of the unfolding Planetary Phase Shift.
5.1 Inflation Volatility and Monetary Limits
Shale’s ability to expand rapidly in response to price spikes made it a de facto tool of inflation suppression. When Brent surged, shale growth returned quickly - stabilising global prices and shielding U.S. consumers from prolonged fuel cost increases.
With output now flatlining, that responsiveness is gone. And with it, the inflation buffer.
The Federal Reserve estimates that a sustained $10 increase in WTI crude oil raises U.S. headline inflation by 0.2 to 0.4 percentage points, depending on pass-through effects. In an economy still battling post-pandemic price instability, this exposure is non-trivial.
Between 2023 and 2025, average U.S. gasoline prices have remained between $3.60 and $4.10/gallon, despite stable global demand. The reason is not market manipulation - it is domestic production fragility. With no short-cycle growth surge, prices are more vulnerable to seasonal swings, geopolitical disruptions, and refinery outages.
This limits the Federal Reserve’s capacity to use interest rates effectively. Structural energy inflation cannot be resolved through monetary tightening - it requires supply-side resilience. But shale can no longer deliver that on command.
5.2 Trade Deficits and the Shale-Export Mirage
One of the great underappreciated achievements of the shale era was its impact on the U.S. trade balance.
By 2019, the U.S. had become a net exporter of petroleum products. That surplus helped stabilise the current account - even as goods and services deficits widened. In 2022, energy exports reached nearly $400 billion, acting as a buffer against dollar weakness and trade volatility (BEA 2023).
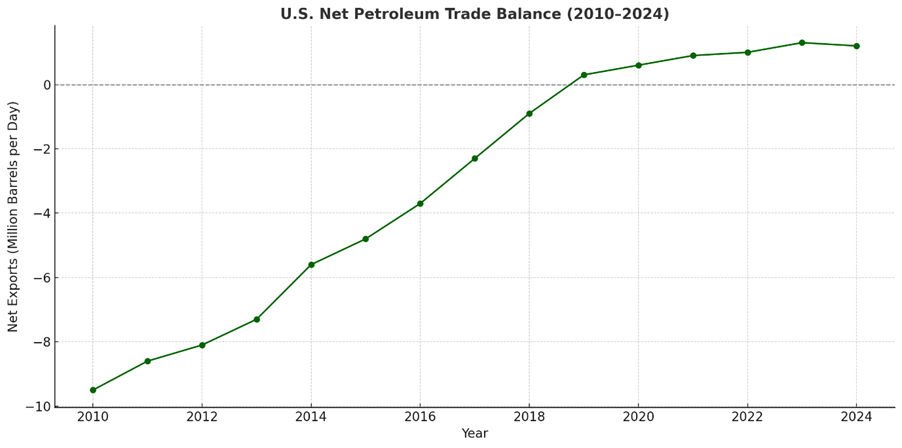
Now, that surplus is at risk. According to the EIA, U.S. crude exports are expected to decline modestly by 2026 as flat production meets rising domestic demand. A drop of even 300,000 barrels per day in net exports could widen the U.S. trade deficit by $15–20 billion annually, depending on oil prices.
This shift is structural. The U.S. will remain a major producer - but without the capacity to expand exports in response to price incentives, its role as a global energy stabiliser fades. That loss feeds directly into current account deterioration, a key driver of dollar risk, debt accumulation, and fiscal tightening.
5.3 Fiscal Exposure and Regional Fragility
At the subnational level, the fiscal impact of shale’s plateau is already visible.
In states like New Mexico, North Dakota, and Texas, oil and gas revenues provide a major share of public budgets. According to the New Mexico Legislative Finance Committee, projected severance tax income could fall by $1 billion per year by 2027 if production declines from Tier-1 depletion and regulatory cost increases.
This affects everything from public education and healthcare to infrastructure investment and bond ratings. For states that have not diversified their revenue base, even modest production declines create structural budget gaps.
At the federal level, royalty revenues from onshore and offshore drilling - including shale basins - fund a range of programs via the Office of Natural Resources Revenue. As output stagnates, so do these fiscal buffers.
In planetary phase shift terms, this is a classic case of resilience erosion: short-term windfalls create long-term exposure when the energy base deteriorates. Without anticipatory governance, regional collapse risks increase.
5.4 The Dollar Feedback Loop Is Weakening
Perhaps the most systemic macroeconomic risk from the shale plateau is its effect on the energy-dollar feedback loop.
U.S. dollar dominance has long been reinforced by the global oil trade. As energy importers needed dollars to purchase oil, demand for U.S. Treasuries remained high, keeping interest rates low and credit conditions stable. The shale boom turbocharged this: the U.S. didn’t just trade oil in dollars - it became a major energy exporter itself.
Now, with shale growth over, the underpinnings of dollar demand are softening. If net exports fall, and if more countries seek to diversify energy trade into alternative currencies - yuan, euros, rupees - the demand floor for the dollar weakens.
This is not an immediate collapse scenario. But it signals a transition to a multipolar reserve system, where the dollar’s role diminishes and exchange rate volatility increases - particularly for commodity-linked currencies.
The Bank for International Settlements (BIS) warns that even modest shifts in global energy trade currency composition could reshape global liquidity flows, affecting U.S. monetary autonomy.
In a world without shale growth, the U.S. dollar is no longer the energy anchor it once was. And macroeconomic policy must now adjust to this emerging post-dollar energy system.
5.5: The Macro Floor Is Eroding
The macroeconomic order of the past 15 years - low inflation, stable trade deficits, resilient subnational budgets, and dollar supremacy - was not accidental. It was underwritten by shale.
Now that system is losing its energetic foundation. And as the supply base flattens, the macro buffer it provided is fraying.
This doesn’t signal imminent economic crisis. But it does signal a deepening of systemic fragility - where shocks propagate faster, recovery is slower, and monetary tools lose potency.
In Planetary Phase Shift terms, this is the unfolding of the release phase: where past growth has created complex interdependencies that now begin to unravel under the weight of energetic constraint.
The macro system, like the resource system, is stalling. And its architects are not ready.
6. Geopolitical and Strategic Risk Analysis
The rise of U.S. shale reshaped global power. It allowed Washington to tighten sanctions on adversaries without fearing energy shortages, displace OPEC’s influence, and weaponise energy flows as a tool of economic statecraft. More subtly, it underpinned the illusion of American energy invulnerability - enabling a sprawling military presence abroad while reducing net dependency at home.
Now, that leverage is evaporating.
As shale production stalls, the geopolitical architecture it helped sustain is beginning to unravel. The consequences are not just strategic. They are systemic. The energy-based scaffolding of U.S. dominance - from sanctions enforcement to reserve currency status - is cracking under the weight of geological constraint.
This section identifies four emergent risks: the return of OPEC+ as market-maker, weakening U.S. sanctions power, reserve currency diversification, and rising instability in oil-importing states. Together, they mark the geopolitical edge of the Planetary Phase Shift.
6.1 The Return of OPEC+ as the Swing Producer
During the shale boom, U.S. production gains flooded the market with supply. This weakened the price-setting power of OPEC+, drove Russia and Saudi Arabia into reactive postures, and undercut the rationale for tight market management.
That era is over.
With the U.S. now producing near its geological and financial ceiling, and with little capacity to respond rapidly to price spikes, the world is becoming more reliant on OPEC+ for market balancing. As of mid-2025, spare capacity within OPEC+ - particularly in Saudi Arabia and the UAE - is estimated at 3–4 million barrels per day. This gives the group unprecedented leverage over price floors, production ceilings, and global liquidity flows (IEA Oil Market Report, May 2025).
But this power comes with fragility. If OPEC+ miscalculates - over- or under-tightening in response to U.S. supply constraints - volatility will increase. And as the energy transition accelerates, internal divisions between producers (e.g., Gulf states vs. Russia) could deepen, creating instability in the very system that is now reabsorbing central control.
6.2 U.S. Sanctions Power Is Fraying
Energy leverage has long been central to U.S. foreign policy. Washington’s ability to impose secondary sanctions on Iran, Venezuela, and Russia depended on one underlying assumption: that global markets could absorb lost supply through U.S. production growth.
That assumption no longer holds.
In early 2025, the U.S. pushed for tighter enforcement of sanctions on Iranian crude exports - particularly to India and China. The response was muted. Officials in Delhi and Beijing signalled concern about price volatility and growing U.S. supply inflexibility. Quiet exemptions and backdoor deals proliferated.
This is the new reality. Without the ability to backfill lost barrels, U.S. sanctions lose credibility. Target states become bolder. Allies become more reluctant. The entire model of energy-backed coercion begins to unravel.
From a Planetary Phase Shift perspective, this is a classic sign of institutional overshoot: a system of power persists in form, but loses function as the material conditions that support it deteriorate.
6.3 Petrodollar Fragility and Reserve Currency Drift
The shale boom didn’t just affect energy markets. It reinforced the global centrality of the U.S. dollar. As the U.S. became a major oil exporter, and as most global crude remained dollar-priced, the energy-dollar feedback loop deepened: more dollar trade → more dollar demand → stronger Treasury markets → greater U.S. fiscal space.
But now, as shale flattens and the multipolar energy system emerges, this loop is under strain.
Several key trends signal a drift away from dollar centrality:
- China continues expanding its yuan-based oil contracts with the UAE and Saudi Arabia.
- India has begun settling Russian crude purchases in rupees.
- Russia and Iran are expanding energy barter and gold-based trade systems.
According to the Bank for International Settlements, even modest diversification in oil trade currency can reduce demand for U.S. Treasuries, raise the cost of global dollar liquidity, and weaken the Fed’s global transmission power.
This is not an imminent collapse of the dollar. But it is a long arc of erosion, accelerated by the end of U.S. supply elasticity. Without the capacity to influence markets through volume, the dollar becomes more vulnerable to fragmentation - and the global financial system more exposed to volatility.
6.4 Political Instability in Energy-Importing States
The final - and perhaps most dangerous - geopolitical consequence of the shale plateau is rising pressure on oil-importing emerging markets.
When U.S. supply could respond to price spikes, importers had time to adjust. Subsidy regimes were manageable. Exchange rate shocks were contained. That buffer is gone.
As oil stabilises at structurally higher price floors - likely above $80 Brent by 2027 - net importers like Pakistan, Egypt, Türkiye, Ghana, and Bangladesh face mounting twin deficits: trade imbalances and fuel subsidy burdens. Many of these countries already rely on IMF support. Energy price shocks could trigger sovereign debt crises, regime collapse, or widespread social unrest.
The IMF World Economic Outlook 2025 estimates that a $10 increase in Brent oil reduces EM GDP by 0.3 percentage points on average. In vulnerable states, the effect is larger and nonlinear - compounding political instability.
From a Planetary Phase Shift lens, these are the most visible early indicators of systemic release: where energetic constraint meets institutional brittleness, collapse is no longer hypothetical - it becomes kinetic.
6.5: End of Petrohegemony, Rise of Fragmentation
The shale boom underpinned a decade of American petrohegemony - a regime in which U.S. energy abundance, dollar centrality, and military dominance operated in tandem.
The plateau now underway is breaking that alignment.
OPEC+ is back in charge. Sanctions are losing bite. The dollar is drifting into contested space. And energy-importing states face rising systemic risk.
This is not merely a new energy geography. It is a global reorganisation of power, shaped by the energetic conditions of a contracting fossil order.
In this emerging world, resilience replaces dominance. Multipolar volatility replaces unipolar stability. And the rules of the post-2000 energy order no longer apply.
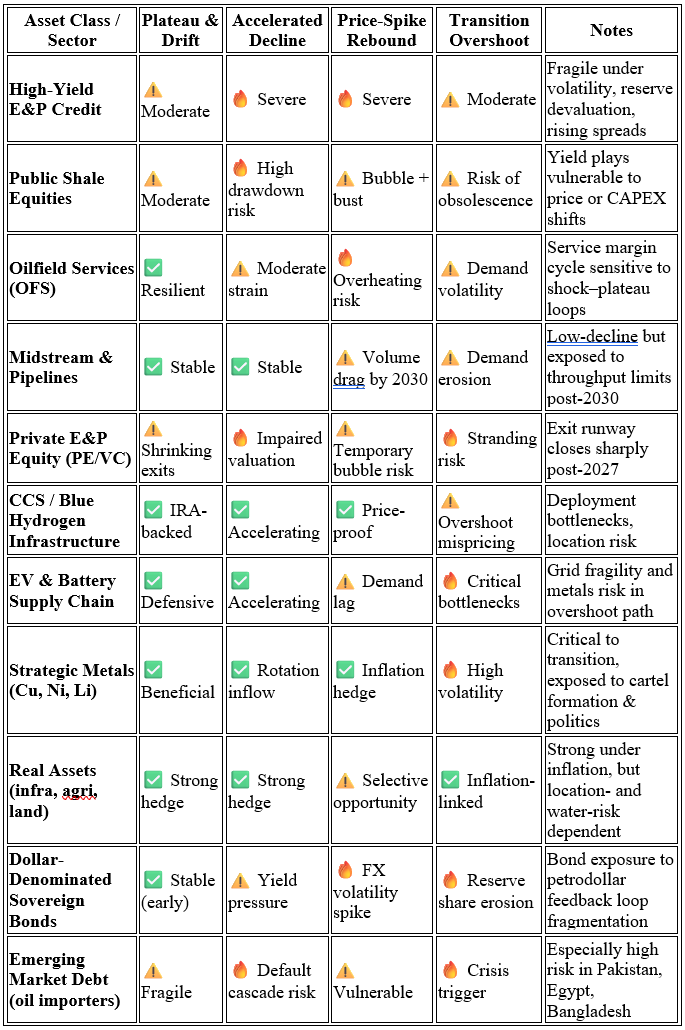
7. Risk Horizon Scenarios: 2025–2035
The strategic implications of the U.S. shale plateau are not confined to a single deterministic outcome. Instead, the current moment opens onto a range of interlocking trajectories - each shaped by different variables: the pace of geological decline, the response of capital markets, the velocity of policy change, and the adaptability of global institutions.
To navigate this landscape, we present four integrated risk horizon scenarios spanning the 2025–2035 period. These scenarios offer decision-makers a structured map of emergent dynamics under varying assumptions - and identify early signals that will reveal which path the global system is entering.
Each scenario is grounded in the Planetary Phase Shift model: recognising energy decline as a systemic inflection, not an isolated event. That inflection creates feedback loops - economic, geopolitical, institutional - whose impacts are nonlinear and path-dependent.
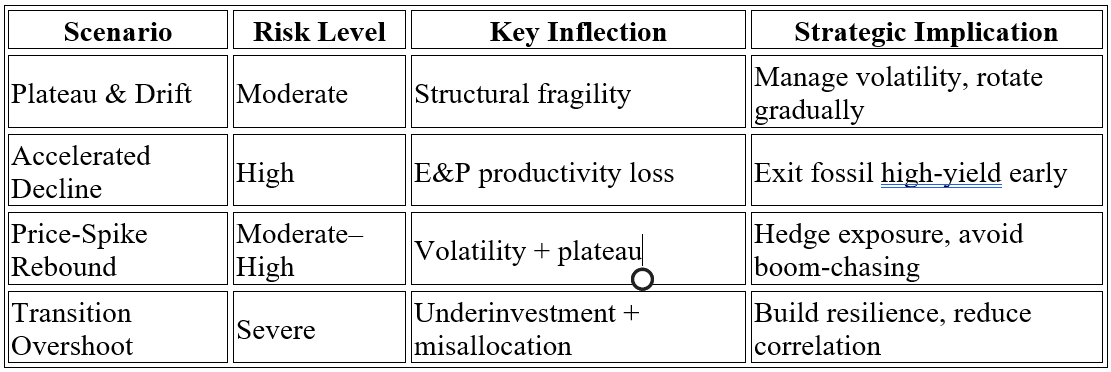
SCENARIO 1: Plateau and Drift (Base Case)
Summary: U.S. shale production remains near 13.4 mb/d through 2029, with slow erosion thereafter. Global markets adapt, but fragility increases.
- Energy system: Production plateaus due to Tier-1 exhaustion and capital discipline; no major supply shocks.
- Investment: Equity valuations stabilise; debt markets tighten slightly; transition capital rotates unevenly.
- Macroeconomics: Mild but persistent energy inflation; current account deficit widens; Fed struggles with rate calibration.
- Geopolitics: OPEC+ regains partial control; U.S. sanctions power weakens gradually; dollar erosion remains marginal.
Risk Level: Moderate
System Signal: Structural fragility, manageable volatility
Early indicators to watch:
- Flat rig count elasticity despite WTI > $80
- DUC inventories below 4-month supply
- Treasury market volatility during oil spikes
- Rising use of non-dollar contracts in energy trade
SCENARIO 2: Accelerated Decline and Shock Repricing (Downside Case)
Summary: By 2027, Permian and Bakken production begins to fall >300,000 bpd annually due to Tier-1 depletion, productivity loss, and policy drag. Price and credit shock ensues.
- Energy system: U.S. crude drops below 12.5 mb/d by 2030; global markets scramble for replacement.
- Investment: High-yield E&P defaults spike; stranded asset write-downs mount; capital rotates into transition with panic premiums.
- Macroeconomics: Structural inflation anchors above 3%; trade imbalance triggers dollar correction; recession risk increases.
- Geopolitics: Petrodollar regimes collapse in weak states; geopolitical volatility spreads through Global South; U.S. military deterrence diminishes.
Risk Level: High
System Signal: Uncontrolled release phase
Early indicators to watch:
- New-well EUR/ft declines >10% across Permian
- Tier-1 inventory drops below 5 years in major E&P portfolios
- Sub-investment-grade debt market spread spikes
- Gold/yuan/rupee oil settlements hit >5% of global volumes
SCENARIO 3: Price-Spike Rebound (Shock-to-Plateau Transition)
Summary: A major supply disruption (e.g. Middle East conflict, Venezuela collapse) triggers a 2026 oil price spike to $120+/bbl. U.S. shale output rises briefly, then flattens, revealing loss of spare capacity.
- Energy system: Temporary growth surge; rapid DUC depletion; steep drop-off by 2028.
- Investment: Capital flood into upstream and oilfield services; rapid inflation of E&P equity, then crash.
- Macroeconomics: Oil-driven CPI spike >6%; policy tightening triggers recession; weak-dollar cycle begins.
- Geopolitics: U.S. loses credibility as stabiliser; OPEC+ splinters; China builds strategic energy blocs.
Risk Level: Moderate to High
System Signal: Phase shift exposure via price volatility
Early indicators to watch:
- WTI–Brent spread inversion >$5
- Global SPR drawdowns exceed 200mbbl in 6 months
- Sharp OFS inflation (>10%) with rig count lag
- G7 coordination failure on oil-price cap regimes
SCENARIO 4: Transition Overshoot (High-Volatility Phase Shift)
Summary: A premature global shift away from fossil capital (under ESG and net-zero mandates) leads to underinvestment in residual oil supply. Transition infrastructure lags. By 2032, both fossil and clean energy are underperforming.
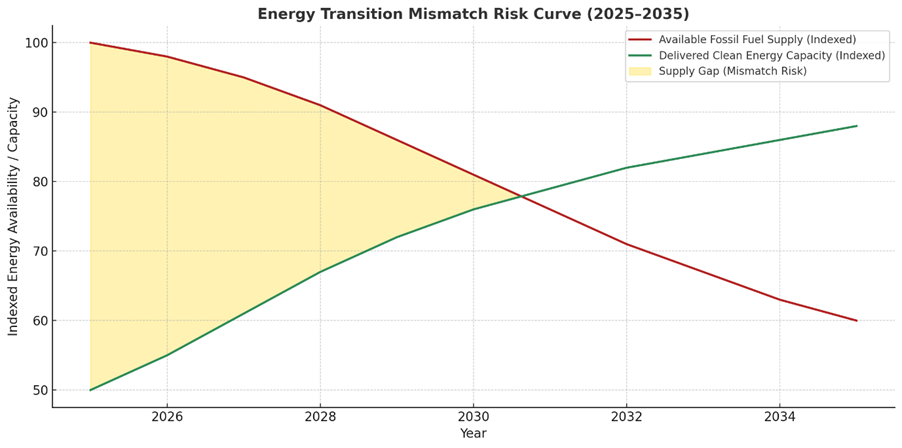
- Energy system: Oil plateaus then declines; EV and grid deployment too slow to compensate; global energy supply gap.
- Investment: Fossil capital stranded prematurely; renewables overvalued and underbuilt; systemic capital rotation failure.
- Macroeconomics: Structural stagflation; supply bottlenecks in grid, EV, metals; central banks lose monetary control.
- Geopolitics: Global power vacuums widen; supply-chain protectionism increases; climate diplomacy collapses.
Risk Level: Severe
System Signal: Systemic transition breakdown
Early indicators to watch:
- Global fossil fuel CAPEX <50% of replacement rate
- EV supply chain disruptions in critical minerals (lithium, nickel, copper)
- Grid instability events increase in >10 major economies
- Carbon credit and emissions markets decouple from real reductions
Scenario Synthesis
These scenarios are not mutually exclusive. Elements of each may combine as the decade unfolds. But the message is clear:
The world is entering a post-shale, energy-constrained macro environment. Every risk vector - from asset prices to regime stability - must now be reassessed in that light.
8. Strategic Recommendations
The plateau of U.S. shale represents a structural constraint on the energetic foundation of the global economy. As this report has shown, the consequences are already rippling through investment flows, macroeconomic assumptions, and geopolitical configurations.
Yet this moment is not simply one of constraint - it is also one of unprecedented strategic opportunity. Those actors who understand that we are living through a planetary phase shift - a nonlinear transition in energy, finance, and institutional coherence - will be best positioned to navigate the turbulence ahead.
This final section offers strategic guidance across three interlinked domains: investment strategy, macroeconomic policy, and global transition architecture.
8.1 For Investors: Reallocate for Entropic Resilience
1. Exit fragile fossil growth plays early.
- High-yield shale debt and high-multiple E&P equities are vulnerable to abrupt repricing under decline scenarios. Sell before the plateau narrative becomes consensus.
2. Prioritise low-decline, long-hold energy assets.
- Midstream infrastructure, storage, and conventional fields with high EROI and low OPEX offer resilience. Hedge against price volatility, not volume exposure.
3. Reweight toward strategic minerals and electrification baseload.
- Copper, lithium, transmission, geothermal, and demand flexibility systems will define Phase Shift capital rotation - but only if supply chains are stable and systemic risk is understood.
4. Build optionality into portfolios.
- Use scenario planning and adaptive metrics. Avoid overconcentration in any one transition pathway (e.g., over-leveraging into EVs or CCS).
5. Integrate systemic risk into ESG analysis.
- Move beyond narrow carbon metrics. Consider asset exposure to EROI, supply fragility, water risk, and institutional resilience.
8.2 For Policymakers: Design for System-Level Resilience
1. Rethink energy security.
- Shift focus from “cheap oil” to minimum energy service continuity across grid, transport, and heating. Diversify supply. Invest in regional microgrids and flexible demand-side infrastructure.
2. Reform the Strategic Petroleum Reserve (SPR).
- Refill strategy must account for shale plateau. Consider coupling SPR to transition assets: e.g., strategic battery storage reserves or critical mineral stockpiles.
3. Support post-oil regional transitions.
- States like Texas and New Mexico face fiscal cliffs. Create place-based industrial strategies to build post-carbon job markets and tax bases.
4. Buffer the inflation channel.
- Use public investment in energy efficiency and transport alternatives to reduce exposure to oil-price pass-throughs. Prioritise just-access mobility over vehicle electrification alone.
5. Prepare the monetary system for reserve fragmentation.
- Anticipate multiple energy-currency systems. Build SDR-based hedges and bilateral trade clearing systems that de-risk against dollar volatility.
8.3 For Transition Leaders: Avoid the Trap of Linear Thinking
1. Plan for turbulence, not smooth curves.
- Fossil fuel decline will not be linear, and neither will renewable scale-up. Build in contingency, redundancy, and political volatility into all project models.
2. Anchor transition investment to real-world energy physics.
- Focus on technologies with positive net energy returns, low resource intensities, and systemic co-benefits (e.g. agrovoltaics, low-heat geothermal, decentralised storage).
3. Fund post-carbon governance capacity.
- Many governments are institutionally unprepared for multi-systemic energy descent. Support civil service training, local economic sovereignty, and participatory policy design.
4. Use finance as a steering mechanism.
- Climate finance must go beyond mitigation: use conditional lending, blended finance, and sovereign risk buffers to de-risk adaptation and infrastructure reconfiguration.
5. Communicate systemic foresight.
- Shift the narrative from decarbonisation-as-cost to transformation-as-opportunity. Frame the decline of shale not as loss, but as liberation from a brittle past.
Final Note
We are not in a cyclical market. We are in a systemic transition.
The end of easy shale marks the boundary between an extractive growth paradigm and the emergent logic of resilience, redistribution, and reorganisation. Those who adapt to this logic early - not just with rhetoric, but with capital, governance, and design - will be the ones who shape the post-carbon global order.
We are entering the reorganisation phase. Invest accordingly.
Disclaimer
This report is published by Age of Transformation for informational and educational purposes only. It does not constitute investment advice, an offer or solicitation to buy or sell any financial instrument, or a recommendation to adopt any investment strategy. The views expressed are those of the authors and do not necessarily reflect the positions of any affiliated institutions, clients, or collaborators.
While reasonable care has been taken to ensure the accuracy of the information contained herein, Age of Transformation makes no representations or warranties as to the completeness, accuracy, or timeliness of the report or its contents. The information and projections provided are based on publicly available data, academic literature, and third-party sources believed to be reliable at the time of publication, but may be subject to revision without notice.
This report may contain forward-looking statements, including scenario analyses, estimates, and opinions regarding potential future outcomes. These statements involve inherent uncertainties and are not guarantees of future performance or events. Actual outcomes may differ materially from those expressed or implied.
Neither Age of Transformation, its authors, nor its affiliates accept any liability whatsoever for any direct or consequential loss arising from any use of this publication or its contents. Readers should seek independent financial, legal, and/or professional advice before making any investment decisions.
This publication is intended for a global audience, including institutional investors, policy professionals, the media, and the general public. It is not tailored to the specific investment objectives or financial circumstances of any individual or entity. Age of Transformation is not a registered investment adviser and assumes no fiduciary duty to any reader of this report.
References
Ahmed, N. (2017). Failing States, Collapsing Systems: BioPhysical Triggers of Political Violence. Springer. https://link.springer.com/book/10.1007/978-3-319-45142-8
Ahmed, N. (2024). “Planetary phase shift” as a new systems framework to navigate the evolutionary transformation of human civilisation. Foresight 28 March 2025; 27 (2): 240–266. https://doi.org/10.1108/FS-02-2024-0025
Bank for International Settlements. (2024). The dollar in global trade and finance: Trends and fragilities. https://www.bis.org/publ/work1049.htm
Bloomberg. (2025). US High Yield Energy Index. https://www.bloomberg.com/quote/BHYETRUU:IND
Carbon Tracker Initiative. (2023). Beyond Petrostates: The Fiscal Cost of Fossil Fuel Decline. https://carbontracker.org/reports/petrostates-of-decline/
Dallas Federal Reserve. (2025). Energy Survey – Q1 2025. https://www.dallasfed.org/research/surveys/des/2025/2501
Evercore. (2025). Upstream M&A Tracker. https://www.evercore.com/our-transactions/
Gunderson, L. H., & Holling, C. S. (2002). Panarchy: Understanding Transformations in Human and Natural Systems. Island Press.
Hall, C. A. S., Lambert, J. G., & Balogh, S. B. (2009). EROI of different fuels and the implications for society. Energy Policy, 38(2), 662–667. https://www.cell.com/trends/ecology-evolution/fulltext/S0169-5347(09)00115-5
International Energy Agency. (2025). Oil Market Report – May 2025. https://www.iea.org/reports/oil-market-report-may-2025
International Monetary Fund. (2025). World Economic Outlook – April 2025. https://www.imf.org/en/Publications/WEO/Issues/2025/04/22/world-economic-outlook-april-2025
IPCC. (2023). AR6 Synthesis Report: Climate Change 2023. https://www.ipcc.ch/report/ar6/syr/
Lambert, J. G., Hall, C. A. S., Balogh, S. B., Gupta, A., & Arnold, M. (2014). Energy, EROI and quality of life. Energy Policy, 64, 153–167. https://www.mdpi.com/1996-1073/7/10/5806
Lenton, T. M., Rockström, J., Gaffney, O., Rahmstorf, S., Richardson, K., Steffen, W., & Schellnhuber, H. J. (2019). Climate tipping points - too risky to bet against. Nature, 575(7784), 592–595. https://www.nature.com/articles/d41586-019-03595-0
McKinsey & Company. (2025). Global Energy Perspective 2025. https://www.mckinsey.com/business-functions/sustainability/our-insights/global-energy-perspective
PitchBook. (2024). Infrastructure Funds Fuel the Energy Transition. https://pitchbook.com/news/reports/q4-2024-pitchbook-analyst-note-infrastructure-funds-fuel-the-energy-transition
Rystad Energy. (2025). Shale Strategic Outlook 2025. https://www.rystadenergy.com
TGS. (2025). Well Performance Analysis – Delaware Basin. https://www.tgs.com
U.S. Energy Information Administration. (2025). Short-Term Energy Outlook – July 2025. https://www.eia.gov/outlooks/steo/
U.S. Energy Information Administration. (2025). Drilling Productivity Report. https://www.eia.gov/petroleum/drilling/
U.S. Environmental Protection Agency. (2024). Final Methane Rule. https://www.epa.gov/newsreleases/epa-finalizes-strongest-ever-pollution-standards-cut-methane-emissions-oil-and-gas


)